Quantcast
Channel: Nagios Labs
Viewing all 65 articles
Browse latest View live

Nagios XI 2012 Public Beta

$
0
0

After many months of anticipation and hard work, we are pleased to announce Nagios XI 2012 Beta is ready for public testing! XI 2012 is loaded with a variety of new features, and we’d love your help in making sure that 2012 is ready for full release as soon as possible. A key difference with the release of 2012 is that there will be both an Enterprise Edition and a Standard Edition, with the Enterprise Edition being targeted at users with larger environments.

Download Nagios XI 2012 Beta

2012 Standard Edition:

  • New Core Config Manager
  • Configuration Rollback
  • Tools menu for external URL tools
  • Bandwidth Report
  • Executive Summary Report
  • Custom Action URL’s
  • Nagios BPI 2
  • Emailed Reports
  • Nagios Mobile now included
  • Automatic installation of all current components, dashlets, and wizards
  • Improved Autodiscovery Wizard
  • Custom Home page
  • NRDS Config Manager

2012 Enterprise Edition

  • *All features mentioned above*
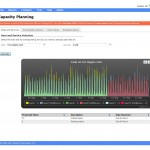
  • Capacity Planning Report
  • Bulk Renaming Tool
  • Bulk Modifications Tool
  • Escalation Wizard
  • SSH Terminal access built into the UI
  • Scheduled Reporting
  • Scheduled Page Report
  • Notification Settings Management
  • Nagios BPI Hostgroup and Servicegroup Syncing
  • Audit Logging


Beta Installation Notes:

  • We recommend using the 2012 Beta as a fresh install or an upgrade for test environments only until the production version is ready.
  • The upgrade script will backup all currently installed wizards, components, and dashlets to the /tmp directory to account for custom modifications to any Nagios XI addons.
  • The upgrade to 2012 will update any current wizards, components, and dashlets released by Nagios enterprise to their latest versions. This particular upgrade step will only happen one time once the full production version of 2012 is posted. This is done to allow users to safely modify components and wizards without being overwritten with each upgrade.
  • The Admin->SSH Terminal access uses SSL and requires browser acceptance of the certificate the first time it is used. (Open in a new tab).
  • Any new components and wizards can be removed after the upgrade if not desired
  • Home dashboards will be updated to the new default home splash after the upgrade. The default home dashboard can be brought back by selecting the “Change my default home page” link at the top right of the home page.
  • Nagios BPI 1.x users will have to migrate their configuration for use with Nagios BPI 2.x, since groups are now calculated differently.
  • The previous version of the Core Config Manager is still available in the menu system by selecting “Legacy CCM”
  • The Beta release will be versioned as release candidates: 2012r1.0rc3 and incrementing up from there
  • The 2012 Enterprise Edition trial functions the same for the beta version as it does for production.
  • The enterprise edition trial lasts for 60 days with full functionality.


Our current beta revision at the time of this article is RC3. If you’d like to receive updates for each new beta revision, post a comment to this article and we’ll get you added to the update mailing list. Bug reports and technical inquiries can be posted to our support forum.
cap_planning1 2012_6 2012_5 2012_4 2012_3 2012_2 2012_1 ccmb10 bandwidth2 nocscreen1 ccmb5 ccmb4 ccmb2 ccmb1

Nagios Network Analyzer Public Beta

$
0
0

A solution for evaluating and using Netflow and sFlow data has been on the horizon in the Nagios Labs here for a while, and we are now calling for public beta testers for the product. If you would be interested in beta testing such an application please note your interest in the comments below and I will contact you so that we can work together to resolve issues that present themselves in Nagios Network Analyzer.

Nagios Network Analyzer has direct integration with Nagios Core and Nagios XI, and is designed to be used in conjunction with either, while still containing enough of its own features to be functional as a standalone application. It is also designed be very intuitive to use, and to browse your flow data in as straightforward and painless a manner as possible, without sacrificing flexibility.

Report Image Image3


Integrating Mod Gearman with Nagios XI

$
0
0

Our newly released guide is now available on how to install Mod Gearman locally on your Nagios XI system(s) and from there tie it in with external worker systems to offload checks from the hardware Nagios XI resides on. This will reduce check latency and increase performance on your Nagios XI machine, allowing for greater check amounts while still keeping your system’s head above water. All this done with a simple install script for CentOS/RHEL versions 5 and 6.

The document is available here: Integrating Mod Gearman with Nagios XI

Building a Nagios 4 / Nagios XI Prototype Box

$
0
0

So after an awesome set of presentations at the Nagios World Conference 2012, one of the hot topics for discussion was clearly the upcoming Nagios Core 4 release. Andreas Ericsson has been hard at work overhauling the Core engine to optimize performance and reduce Disk and CPU usage for Nagios, and initial tests are showing his work has paid off in a substantial way. For this experiment, we’re going to use a system with the following specs:

  • Virtual Machine running under Vmware Workstation 8
  • 2GB of RAM
  • 1 CPU, 4 Cores
  • 80GB Hard Disk
  • Nagios XI Installed
  • Nagios binaries replace with Nagios 4 monitoring engine
  • ndoutils binaries replaced with with the latest SVN code for ndoutils: nagios/ndoutils/branches/ndoutils-2-0
  • No initial performance tweaks other than Nagios 4 and ndoutils 2

I’ll post setup instructions below for users who also want to play around with this setup. Note: This setup is not intended for production installs, use this in test environments only!

Start with Nagios XI installed, either through the pre-installed VM or with a manual installation. I chose a manual installation for this demo so I could set up the hardware to my liking and give it sufficient hard drive space to test a LOT of hosts. My first attempt at the prototype only had 10GB on the box, and filled up quite quickly because of performance data. .I ran the following commands after initial Nagios XI installation and setup was completed.

From the command-line:

cd /tmp
yum install -y subversion
svn co https://nagios.svn.sourceforge.net/svnroot/nagios/ndoutils/branches/ndoutils-2-0
svn export ndoutils-2-0/ ndoutils
svn co https://nagios.svn.sourceforge.net/svnroot/nagios/nagioscore/trunk/ coretrunk
svn export coretrunk/ nagioscore
service nagios stop
service ndo2db stop
cd nagioscore
./configure --with-command-group=nagcmd
make all
make install
cd /tmp/ndoutils
./configure; make; make install
cd db
./upgradedb -u root -p nagiosxi -h localhost -d nagios
service ndo2db start
service nagios start

You can verify the upgrade succeeded by reviewing the /usr/local/nagios/var/nagios.log file. There should be some new warnings about obsolete definitions like “failure_prediction_enabled”, which we won’t worry about for now. For now I’d like to see what kind of performance impact I can expect for a large number of checks being run on this machine, so I need to quickly create a large number of checks.  I’ll achieve this by running a tools script that we include with every installation of Nagios XI.

cd /usr/local/nagiosxi/tools
./create_checks.php --hosts=1000 --prefix=_MASS1_ > /usr/local/nagios/etc/static/_MASS1.cfg

I chose to use static configs instead of the CCM for this benchmark for ease of setup time, and also easy removal later on. This also creates a list of checks with 25% of the services showing up as critica, which is useful in testing a system stressed with alerts and notifications. However, I’m also going to turn off notifications and event handlers during this setup phase just to make sure I don’t bottleneck somewhere and tank the entire box. Now lets restart Nagios to start using the new configs.

service nagios restart

After adding 1000 hosts and 4000 services all at a 5mn interval the CPU load is running at a nominal level, averaging anywhere from .30 – .70, which is pretty impressive for a 4 core system! There is still some Disk IO because performance data processing is happening for each service, and this will likely be one of the noticeable bottlenecks as we add more checks to this system. After the system levels out and all of the checks are settled into a hard state, I turn on notifications and event handlers and begin watching the system and testing for bottlenecks. I’ll post back with some results soon! If there are any XI users out there who want to give this a shot in their test environments and post back with their results we’d love to hear what you find!


Nagios Network Analyzer Public Beta Download

$
0
0

Due to the overwhelming demand for the Nagios Network Analyzer public beta interest, instead of the more focus-group oriented beta style, we will be posting the download link and install instructions at the bottom of this post.

If you use it, please do keep in mind it is still beta, and there is a feature freeze, as in bugs have the highest priority. Please inform send bug reports or feedback to nscott@nagios.com.

Install Instructions

Getting Started Instructions

Nagios XI Internationalization

$
0
0

After an enormous amount of manual “search and replace” throughout the Nagios XI code base, we are proud to announce that starting with Nagios XI 2012R1.3, there will be internationalization support for the XI interface. We’ve created a default PO language file that users can either contribute back to XI, or use privately within their organization. The language file covers almost all of the XI codebase, and all of the components developed by Nagios Enterprises. We’re currently looking for community members willing to contribute completed, or even partially completed translation files for the XI interface. We currently have contributors who have started working on Spanish and Korean translations, but we’re looking for many more! The default translation file can be downloaded from the link below, and translated with the Poedit application.

Nagios XI Default Language File Download

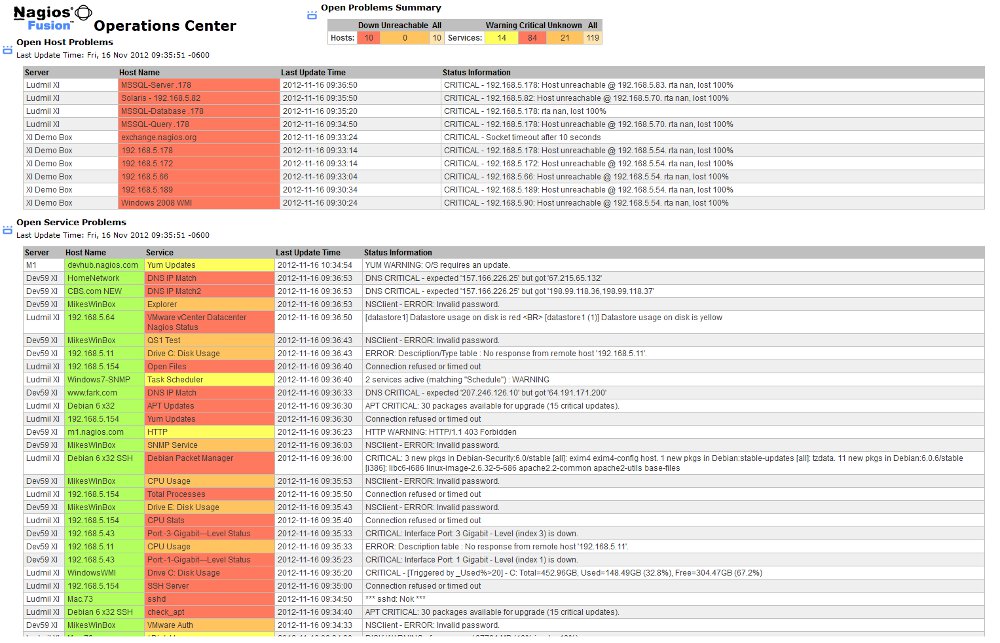
Nagios Fusion Operations Center Component

$
0
0

The Nagios Fusion Operations Center Component provides a single looking glass to all unhandled host and service problems across multiple Nagios XI servers. This component is intended to be a read-only viewing screen screen to watch for problems in a distributed monitoring environment. Currently this component only fuses data from Nagios XI servers, aggregation of Nagios Core servers to come in a future release.

Download Nagios Fusion Operations Center Component


Nagios XI 1.3 New Features For Developers

$
0
0

It seems almost daily that we get new feature requests for Nagios XI, and thanks to a great extensible design by Ethan Galstad, the development team here at Nagios is able to produce new features and components for Nagios XI on a fairly regular basis. However, as the popularity of Nagios XI continues to grow, so does the need for custom features, modifications, and tools for our customers to use. We’ve added several new features and developer hooks into this most recent version of Nagios XI that we wanted to highlight for users who are interested in creating their own custom feature.

#1. Custom login splash. Several of our resellers have requested the ability to customize the login splash page when users log in to direct their end users to their own support channels and services. We’ve add the ability to allow users to specify their own PHP include for that splash by using the Custom Login Component. A template splash file has been added to the Nagios XI directory tree, and will be preserved through upgrades if users want to modify it. This file is located at /usr/local/nagiosxi/html/loginsplash.inc.php.

#2. Custom status column. We’ve added some new callback functions with this release of Nagios XI, one of which is a callback that allows users to add a new table column to the host or service status tables in Nagios XI. A developer example that adds the host notes field to the status tables can be downloaded from the following link. Custom Column Component.

#3. Custom table icons. Thanks to active community member jsmurphy for this one. We’ve added a new callback function in Nagios XI where custom table icons can be inserted the status tables to act as links, or to perform special actions. This feature is demonstrated in the latest version of the Graph Explorer component, where it inserts a graph icon that can be clicked to show a performance graph pop up for the selected host or service right from the status table.


The bottom line is, we love feature ideas! We base our development priorities largely on what users are requesting from us, so if there’s a feature you want to see in Nagios XI, by all means post a request to tracker.nagios.com or discuss an idea with our tech team at our Nagios Ideas forum.

customicon customcolumn


NRPE 2.14 Now Available

$
0
0

A new release of NPRE (2.14) is now available from SourceForge. This release contains a number of changes including enhanced support for AIX as well a patch to prevent a potential security issue arising from passing bash command substitutions as arguments.

Enjoy!

Nagios XI 2012r1.4 Improvements

$
0
0

With each new version of Nagios XI, we do our best to include the most important bug fixes, improvements, and features that we can accomplish in a few weeks time. The upcoming Nagios XI 2012r1.4 is going to be a notable release of XI for both performance improvements and internationalization.

Internationalization

For our international users, we’ve been hard at work to update XI appropriately for internationalization, as well as kick-starting multiple translations using Google translate. We’ve been working to balance code updates with community contributions for languages, and this upcoming release will ship with a default.pot file that can be used to update user’s PO files that they may have begun populating. This release of XI will ship with kick-started translations in the following languages.

  • German
  • Spanish
  • French
  • Italian
  • Portuguese
  • Russian
  • Korean
  • Chinese

Performance Improvements in 1.4

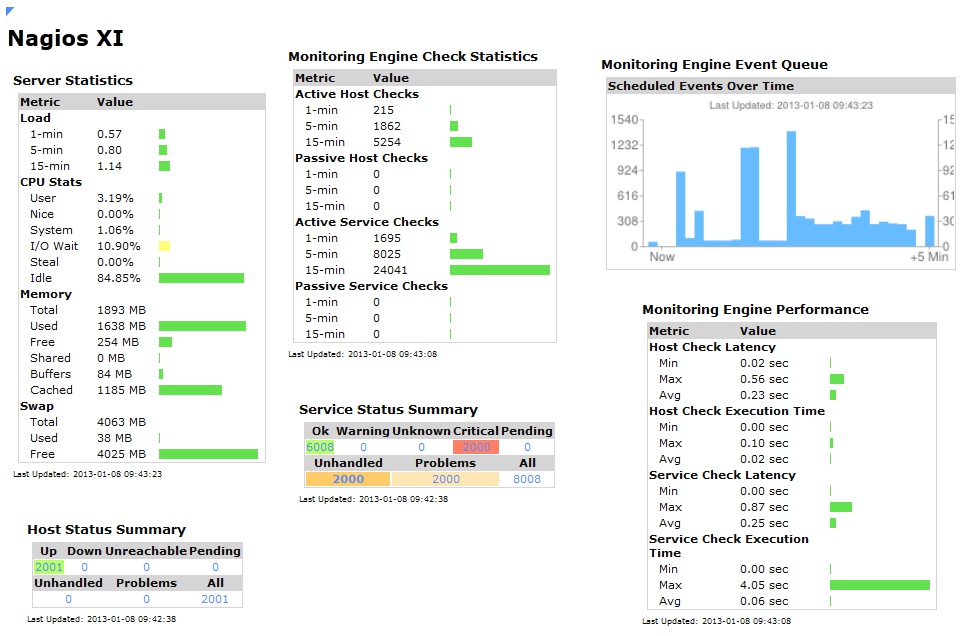
For customers with larger installs, we’ve been analyzing bottlenecks in both the monitoring process and the UI to try and make XI run faster and leaner. Users with hosts+services in the thousands will almost certainly see an improvement both in CPU load and page load times in the UI. For changes that affect the monitoring process, we updated the Monitoring Engine Event Queue dashlet and the Monitoring Engine Check Statistics Dashlets to all pull data from the same status information that the rest of XI uses, which reduces an enormous amount of data from needing to be logged to mysql from the monitoring process. The end result of this change is that mysql will only need to be doing about 30% of the work that it was having to do in previous releases. For large installs, this is a big deal!

The other key change that all users will probably see a benefit from is a refactoring of data queries for AJAX loaded content in the XI interface. Load times for dashlets that contain tactical or summary data went from 15-20 seconds per dashlet down to .05 seconds in local tests with 10k checks. The other upside of this change is that the CPU usage from XI users accessing the interface is substantially reduced. The Tactical Overview dashlets see the largest benefit in load times by far. For users who had to utilize the unified Tactical Overview for performance reasons, we encourage you to try the dashlet version in 1.4.

We hope to have 1.4 ready to release sometime this week, we appreciate our community of users and the feedback that we continue to get for our product. Thanks for helping us make XI better!


Nagios SNMP Trap Interface – NSTI v2.0

$
0
0

NSTI version 2.0 has officially been released.  After a lot of hard work, and many feature-rich additions, the Nagios SNMP Trap Interface has been overhauled to include some major performance increases and greater ease-of-use.

The User Interface has been reimagined and streamlined to make exploring and managing SNMP traps much easier.  The functionality of NSTI 2.0 is not hidden within various menus, but exposed on the main GUI to reveal the capabilities of NSTI.  This allows you to parse through streams of SNMP traps more quickly and efficiently.

NSTI Interface

While creating a more straight-forward version of NSTI, advanced functionality was not forgotten.  NSTI 2.0 provides users with a dedicated screen for each trap that presents all of the data that has been captured from that trap.  This allows for the advanced trap information to be accessed easily without cluttering the main NSTI page.

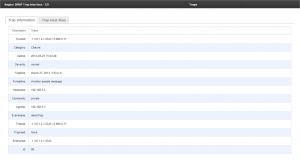
SNMP Trap Information - NSTI

Improvements have also been made to NSTI’s ability to integrate with existing Nagios XI implementations. Integration with Nagios XI makes it easier for system admins to manage and stay on top of SNMP trap information.

  • NSTI now has the ability to write SNMP trap information directly to the Nagios XI server.  This allows checks to be made for unread SNMP traps, and for admins to be alerted to traps based on their status (Critical, Warning, Unknown).
  • Previous SNMP trap management within Nagios XI only showed the last trap that was received, but now NSTI allows you to view all old traps and let the Nagios server know which ones have yet to be read.  This assists the user in keeping track of all historical SNMP trap data.
  • Another major improvement made to NSTI is its ability to force hostname information and sync it with the Nagios XI server.  This allows admins to easily correlate SNMP trap information with the corresponding host on the network, and eliminating tedious sorting of traps and crucial information falling through the cracks.   NSTI Hostname Integration

Official documentation for NSTI 2.0 will be coming soon.  Currently, beta-documentation is available and can be found at: http://assets.nagios.com/downloads/nagiosti/documentation

Please contact nscott@nagios.com for any questions.

Nagios XI 2012r2.0 Now Available

$
0
0

We are pleased to announce that Nagios XI 2012r2.0 is now available. As an ongoing commitment to our customers, this release includes numerous small bug fixes, improvements, and new features to extend upon the most powerful IT infrastructure monitoring solution on the market.

This release includes an upgrade to Nagios Core 3.5.0, which contains bug fixes and updates related to downtime, restarts, and the way non-ASCII characters are handled. To learn more about the changes included in Nagios Core 3.5.0, you may view the changelog here.

Also included in XI 2012r2.0 is an upgrade to NDOUtils 1.5.2, which includes updates to address the effects that low system resources can have on database communications. Read more about NDOUtils 1.5.2 here.

A new feature included in this release is the ability to display a custom logo in your exported reports. In past versions, reports displayed the Nagios XI logo by default, but now with the use of the custom logo component, you may display a logo of your choosing.

An additional feature now allows host aliases (descriptions) to be searched via quick find.

Lastly, as part of this release, XI is now compatible with PHP 5.4.

To view a quick guide on how to upgrade an existing Nagios XI installation to the latest release, click here.

We greatly appreciate the feedback that the Nagios community continues to provide. If there is a feature you would like to see in a future release of Nagios XI, be sure to share your ideas with our tech team in our Nagios Ideas forum!

Securing Nagios XI Web Front-End with Mod_Security

$
0
0

Today we’re going to walk-through installing a web application firewall for Nagios XI. While not mandatory, this is an important task for anyone with a Nagios XI interface that is accessible through the internet. We do our best to create a secure application and make every effort to protect the data accessible via our software. However, mistakes are made and zero-day exploits do happen, as such, implementing additional measures such as mod_security is a great way to add additional difficulty for any potential attackers.

Mod_Security, is an Apache module that enables a host based web application firewall(waf) before any web traffic actually touches the applications served by Apache. This allows attacks such as sql injection(sqli), cross-site scripting(xss), cross-site request forgery(csrf), and many others to be detected and stopped before they have a chance to effect the web application and back-end databases. In the case of Nagios XI we are most worried about things like sqli, xss, command injection, remote and local file inclusion, and path traversal, as these have the most potential to take or modify vital data or gain access to the server. Mod_Security comes with list of predefined set of rules, that companies like Trustwave and groups like OWASP, regularly submit to and maintain. The module and rules definitions are entirely open source, although there are paid variations of the rules as well.

Setting up Mod_Security to protect your Nagios XI interface is pretty straightforward. The general idea is to install yum provided packages, disable some rules that cause issues with Nagios functionality, and restart Apache. Shall we begin?

1) Install Mod_Security packages.

yum install mod_security_crs-extras mod_security mod_security_crs

2) Download the base exclusion configuration for Apache, and move to the correct location.

cd /tmp

wget http://assets.nagios.com/downloads/nagiosxi/misc/mod_security_excluded_rules.conf

cp /tmp/mod_security_excluded_rules.conf /etc/httpd/conf.d/

3) Restart Apache and verify Nagios is working properly.

service httpd restart

Browse to your Nagios XI server and verify login and that everything looks normal.

Further documentation and troubleshooting can be found at: Integrating Mod_Security with Nagios XI

Deploying Nagios XI Monitoring Software on Linode

$
0
0

We often use Linode for various items at Nagios, and while bringing up a server the other day, I decided to make a Linode StackScripts that will allow users to easily setup a Nagios XI server on Linode that can be used for any of the following, 60 day free trial, testing or production.

While I was testing the script functionality, I also made a quick video documenting the setup process.

New NRDS Config Manager Released

$
0
0

The Latest version of the NRDS Config Manager (version 1.3) is now available!

NRDS Config Manager allows you to centrally define configuration files and plugins for monitoring agents. This centralized configuration tool makes the configuration of monitoring agents easy and flexible.

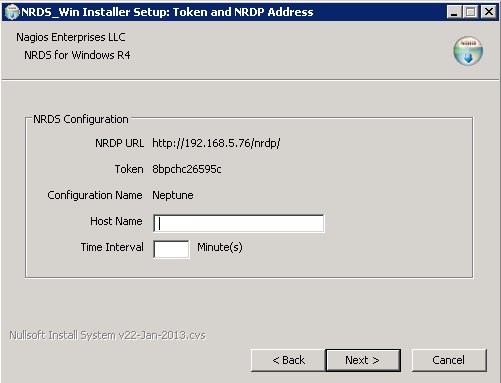
The latest version contains major bug fixes to both NRDS_Win and NRDS_Lin agents. There are also a number of new enhancements, including improved SSL support, an extension handler for common script types, and the ability to build your NRDS_Win installer files on the fly.

NRDS_Win installer

Documentation on latest NRDS_Win capabilities can be viewed at:
http://assets.nagios.com/downloads/nagiosxi/docs/Passive_Monitoring_with_NRDS_Win.pdf

To install the latest version, simply go to the “Admin” menu of Nagios XI and Choose “Manage Components”. Lastly choose “Check for updates” and you will be notified of the latest updates for all components!


Keeping an Eye on Problematic Services with the Status Info Dashlet

$
0
0

The Status Info Dashlet has been available on the Nagios Exchange website for about a year now. It is a very cool dashlet, that in my opinion, doesn’t get the attention it deserves. The Status Info Dashlet allows you to display the current status of a service as a dashlet on a dashboard in nice big numbers, and is especially useful in cases when you want to keep an eye on a problematic service.

Setup and Installation of the Status Info Dashlet is quite easy:

First, you need to download the dashlet from the Nagios Exchange site: Status Info Dashlet
Direct Download Link: statusinfo.zip

Next, add the dashlet from the Nagios XI web interface:
Admin -> System Extensions -> Manage Dashlets -> Browse -> statusinfo.zip -> Open -> Upload Dashlet

Once the dashlet has been successfully installed, you can add it to a dashboard of choice:
Dashboards -> Add Dashlets -> Available Dashlets
and clicking on the “dashify” icon in the upper left corner of the dashlet to add it to a Dashboard .

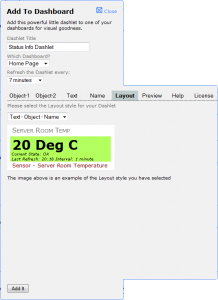
You will see the “Add To Dashboard” interface, which has many different options, allowing you to customize your dashlet. The first three options on the top allow you to set the dashlet’s title, the dashboard, where you would like the dashlet to be added to, and the refresh rate. Below these three options, you will see eight tabs for even more customizations. I will go through each one briefly, and describe the most basic choices.

1) Object-1

Here you can select the object (service), that you want your dashlet to use. You also have an option to show the current service status as text, set the background color, “trim” the output (the beginning or the end), in order to discard the information that you don’t need. You can also show the last refresh time and the refresh interval underneath the object.

2) Object-2

This is NOT a place, where you can select a second object (service) – the name is a bit misleading. Here you can change the object text formatting (text size, weight, style, color, etc.)

3) Text

From here, you can add additional text to your dashlet and style it how you want.

4) Name

The menu allows you to select the name format that you want to appear in the dashlet. The available options are:

- Host
- Host – Service Name
- Service Name
- Service Name – Host

You can also format the text (size, style, color, etc.)

5) Layout

This allows you to select how you want the dashlet displayed. There is a drop-down menu with a various combinations for displaying “Text”, “Object”, and “Name”.

6) Preview

When you click on this tab, you will see a preview of what your dashlet will look like.

7) Help

The help menu explains in details the various options that exist in each section/tab.

8) License

Here you can read the license for this dashlet.

After you selected all of the options you want, just click on the “Add it” button on the bottom. Then you can go to the dashboard, where you added that dashlet and view status info for your service.  You’ve now successfully added the Status Info Dashlet to your Nagios XI views.  It’s as easy as that.

NRPE 2.15 Released – Now with IPv6 Support

$
0
0

NRPE 2.15 was released earlier today. The primary update in this version of NRPE is full support for IPv6.

The NRPE daemon now has the ability to listen on IPv4 and/or IPv6 addresses. In addition, the check_nrpe plugin now accepts switches that specify whether an IPv4 or IPv6 connection should be made to the NRPE daemon. The NRPE daemon has always had the ability to perform checks using IPv6, assuming the plugin it runs supports it. Thanks to Leo Baltus for the patch that made this possible.

IPv6 communication has been tested on Linux (RHEL/CentOS) and is known to work there. It also known to compile on other Unices that we have access to: Solaris 10, AIX 5.3 and 6.1 and HP-UX 11i v1. Feedback on these and other platforms is welcome. Bugs or enhancements (preferably with patches) can be submitted to http://tracker.nagios.org. Other discussion/questions can be sent to the mailing lists or http://support.nagios.com/forum.

Nagios Core 4.0.0 Now Available

$
0
0

We are pleased to announce that Nagios Core 4.0.0 is now available for download. Core 4 brings numerous performance enhancements and new features to a platform that is already the world leader in monitoring. Key changes included in this release are outlined below:

  1. Performance Improvements:
    -  Core Workers (see below for more information.)
    -  Configuration Verification: In Core 4, each configuration item is only verified once with an O(n) operation, whereas in Core 3 it was an O(n^2) operation.
    -  Event Queue: In Core 4, inserting events into the event queue is now an O(log n) operation, whereas in Core 3 it was an O(n) operation.
    -  Macros: In Core 4, macros are now sorted at start-up so that a binary search can be used rather than the linear search that was used in Core 3. In addition, frequently accessed macros such as $USERx$, $ARGx$, and $HOSTADDRESS$ are given special case, early lookups.
  2. Query Handler: The query handler provides a simple interface for external entities communicating with Nagios Core. Core workers use the query handler interface.
  3. Core Workers: The process of performing checks is now handled by a lightweight core worker process.
    -  There are standard worker processes that are created when Core starts that stay running as long as Core is running. This eliminates at least one fork of Nagios Core when a check is performed and in many cases two forks, thus speeding up the checks.
    -  Core workers communicate with the main Nagios Core process with an in-memory IPC mechanism (currently Unix-domain sockets), eliminating the I/O bottleneck that Core 3 encountered while writing and reading check results to/from disk.
    -  The core worker architecture is extensible to special purpose workers that could potentially perform checks even faster and/or distribute the check load.
  4. libnagios: libnagios is a library of functions useful to developers of query handlers and core workers.

For more detailed information on what’s new in Core 4, visit:
http://nagios.sourceforge.net/docs/nagioscore/4/en/whatsnew.html

Major Improvements to Agent-Based Monitoring with the Release of Nagios Cross-Platform Agent — NCPA

$
0
0

Major improvements to agent-based monitoring have been taking place at Nagios Enterprises. NCPA, the Nagios Cross-Platform Agent, is a project that has the potential to revolutionize agent-based monitoring and increase the efficiency of IT support teams world-wide.

As many Nagios users know, monitoring with agents means juggling the installation of many different types of plugins to try and match devices, operating systems, and the basic functions of each agent. For example, in a simple agent-based Linux and Windows server environment you have to install 2 agents, know the 2 user manuals, there are 2 times the troubleshooting hours required, 2 times the commands on remote systems, 2 change logs to sift through for potential update breaks…the list goes on. It can be very difficult to keep organized and take a lot of time to implement and update your configuration, especially when your monitoring environment becomes larger and more complex.

Whether your environment is large or small, there are usually a myriad of devices that need to be monitored and more often than not, some sort of agent needs to be installed on these devices.

Wouldn’t it be simple if you only had to install one agent regardless of operating system or device?

We have been working on a project that aims to do this. Nagios Cross-Platform Agent (NCPA) is a fully contained agent that runs on Mac OS X, Windows, and Linux and seeks to solve all of the previously mentioned pitfalls of agent based monitoring with Nagios. The main goal of NCPA was to monitor the core metrics of a server and other devices without the added hassle of plugins and dependencies. Metrics such as CPU Usage, Disk Usage, Memory Usage, Interface Usage, Swap Usage, User Count, etc. are preloaded in NCPA so that all you have to do is install the agent. It has since broadened in scope to be a general purpose agent that is very good at doing the aforementioned job. Just install the NCPA agent on your system, and away you go.

Features & Benefits of NCPA:

-Installs on multiple platforms : Windows, Linux, Mac OS X and FreeBSD (untested on AIX, HPUX and Solaris)
-Real-time performance graphs and GUI configuration
-Fully contained agent, including dependencies
-Identical cross-platform configuration editing for both active and passive agents
-Minimizes knowledge needed to know down to one
-Advanced visual data representation

Direct links to the NCPA .exe and .rpm files can be found in the installation instructions which can be downloaded at the link below: Installing NCPA.pdf

We are very excited about this new agent and are currently looking for real world testers to try it out. To test NCPA please contact nscott@nagios.com. Thanks!

Nagios XI – Bulk Host Cloning and Import Wizard – New Video Available Now!

$
0
0

If you missed my post from March 2, 2012 on how to clone a host along with its services in Nagios XI, now is the time to revisit this topic. There is a new video available that shows you how to use this amazing tool.

Sometimes it can be a daunting task to set up a monitoring system, especially when you have hundreds of machines that you are trying to monitor, but Nagios makes it simple. The Bulk Host Cloning and Import Wizard is easy to use and allows you to clone a host that has been already set up, according to your specifications, and then copy this “template host” into many other hosts that you want to monitor in the same manner.

For example, if you have 500 devices that you need monitored and you want them all monitored in the same manner, all you need to do is set up the first one. Once that is done, you can clone that template via the Bulk Host Import Wizard into the other 499 hosts so that they will be set up in the exact same manner. This will save you a lot of time and effort!

To see how easy it is to use the Bulk Host Cloning and Import Wizard, please watch our video below. The video is less than 3 minutes long, so it’s not going to take much of your time, but it will teach you:

  • How to select your “template” host, and verify its configuration
  • How to select the services that you need to monitor
  • How to enter the IPs, names, and descriptions of the “new” hosts
  • How to verify that the “new” hosts have been created successfully

Watch this video on YouTube.

For more information on how to use the Bulk Host Import Wizard check out this document:

Nagios XI Bulk Host Import Wizard Usage.pdf

Note: If you watched my presentation (“Bulk Management Of Host And Services In Nagios XI“) during the Nagios World Conference 2012, you probably remember that in the past, you couldn’t clone a host, unless you had at least one service selected. This is changed in the new version of Bulk Host Cloning and Import Wizard as per customer requests. Thank you for your feedback! Now, you can even clone hosts, with no services.

Viewing all 65 articles
Browse latest View live