Quantcast
Channel: Nagios Labs
Viewing all 65 articles
Browse latest View live

Take Control, and Automate Your Network with Event Handlers in Nagios XI

$
0
0

Event handlers have been a major part of Nagios Core and Nagios XI for long time and can greatly increase the efficiency of your network and decrease incident response time. From restarting downed services, forwarding emails to a ticketing systems, or updating thousands of servers, the possibilities for event handlers are limited only by your imagination. Below, you will find the introductory portion of the documentation which will walk you through the creation of your first event handler in its most basic form. If the following example isn’t enough, the full documentation includes a complete tutorial for event handler macros, and more advanced users can learn how to fully customize their Nagios environment.

Step I. Create a command in XI for the event handler
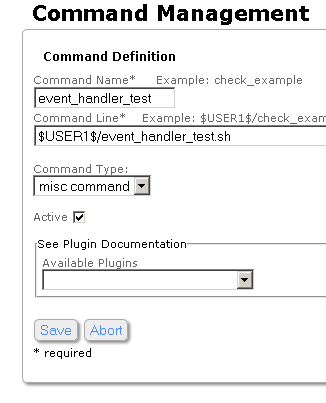
In XI, go to the CCM (Configure → Core Config Manager → Commands). Click “Add New” in the right hand pane. Give the command a name, we will use “event_handler_test” for this example.

Now we need to define the “Command Line”. “$USER1$” references the folder “/usr/local/nagios/libexec” from the resources.cfg file. This is the default path for plugins and scripts in XI. We will create a script later on to be called by this command, and for the sake of uniformity, we will name our script “event_handler_test.sh”.

As this command will not be used to check hosts nor services, but will be used as an event handler, set the “Command Type” dropdown to “misc command”.

Make sure the “Active” box is checked.

The final command definition should resemble the image to the right. Click save when finished.

Step II. Create a dummy host

In XI, go to the CCM (Configure → Core Config Manager → Monitoring → Hosts). Click “Add New”. We will set the “Host Name” field as “event_handler_test”.

As this is just a mock up, set “Address” to the localhost “127.0.0.1”.
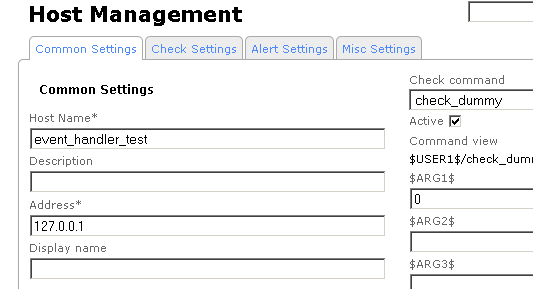
Choose “check_dummy” for the “Check command”.

Enter “0” for $ARG1$. This forces the “check_dummy” command to always return “0” (UP).

Clicking “Test Check Command” should output “OK”, this means you have set up the command correctly.

Set the required defaults:

Under the “Check Settings” tab, enter “5” for “Check interval” and “Max retry attempts”, and “1” for “Retry interval”.

Set the “Check period” dropdown to “xi_timeperiod_24x7”

Under the “Alert Settings” tab, set the “notification period” dropdown to “xi_timeperiod_24x7”.

Step III. Add the event handler to the dummy host
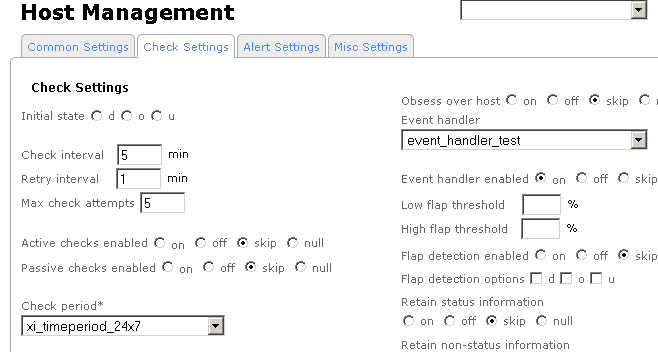
Under the tab “Check Settings” for the dummy host choose “event_handler_test” in the “Event handler” dropdown box.

Enable the event handler by clicking the bullet “on” for the “Event handler enabled” option. Save out and “Apply configuration”.

Step IV. Create a script for the handler to run

Now that the XI event handler and host object are configured, we need to create a script to be run by the handler. The first iteration of the script will just output some *very* basic information to a text file in /tmp. In the proceeding sections of this document we will add functionality and complexities to the script and command of the handler (mostly macros and script logic). But before we get to the fun stuff, lets make sure the basic script works.

Open up a terminal to the XI server and navigate to plugin directory.

cd /usr/local/nagios/libexec

Now create a file named “event_handler_test.sh”, make it executable and edit it:

touch event_handler_test.sh
chmod +x event_handler_test.sh
nano event_handler_test.sh

Paste the following into the file:

#!/bin/bash
DATE=$(date) #sets the DATE variable to the output of the 'date' command
echo "The host has changed state at $DATE" > /tmp/hostinfo.txt #echos text to a file including the contents of the DATE variable.

Save out.

Step V. Test the event handler

Now that everything is in place, we need to force the dummy host into a down state to verify if the hostinfo.txt file is created in /tmp. The easiest was to do this is to submit a passive check with the “Check Result” of “DOWN”. This should trigger the event handler as it will register as a state change.

The XI web interface, go to → Home → Host Detail → Click the Host “event_handler_test” → Click the “Advanced” tab → And then Click “Submit passive check result” under the “Commands” list. Change the “Check Result” dropdown menu to “DOWN” and input “TEST” for the “Check Output” field.

Click “Commit”, and then done. You should see the host change to a down state after a moment or two. Now lets check the hostinfo.txt file from the XI server’s CLI:

cat /tmp/hostinfo.txt

You should see output resembling:

The host has changed state at Sun Jun 2 22:36:22 CDT 2013

Congratulations! You have created your first event handler. With this knowledge, you can automate nearly anything in your environment to keep it running smoothly. Don’t know bash scripting?  No problem! The full document, linked below, includes a number of use cases in bash to get you started.  From emailing a ticketing system to performing yum updates, event handlers can help you create a more self-sufficient network environment and integrate with other systems in your organization.

For the full documentation, click on the link below: Introduction to Event Handlers

Unleashing the Power of Nagios — Utilizing the Actions Component

$
0
0

The “Action URL” component has been quietly deprecated in favor of the newer “Actions” component. The “Actions” component has been released for some time now and has been rolled up into the base install of XI. Although it is most commonly used to add URLs to specific Nagios objects on the details pages in XI, it is by far more advanced than its predecessor “Action URL”. The “Actions” component is truly one of the more powerful components available for Nagios XI, on par with event handlers in extensibility and complexity.
The use cases for the Actions component are near endless. A simple example would consist of the streamlining of repeated tasks, like the adding of common comments to particular hosts. This can be accomplished using the Actions component and the command pipe. For the following example, we will assume that the comment to be added to a host relates to the completion of a successful security audit by the user “auditor”. This action will include the passing of the %host% macro to a script that will write to the Nagios command pipe.

First create a script named “security_audit_completed.sh” in /usr/local/nagios/libexec. The script follows:

#!/bin/bash
HOST=$1
/usr/bin/printf "[%lu] ADD_HOST_COMMENT;$HOST;1;auditor;This host has passed security audit\n" `date +%s` > /usr/local/nagios/var/rw/nagios.cmd

More information about the Nagios command pipe can be found at:
http://nagios.sourceforge.net/docs/3_0/extcommands.html

Make the script executable:

$ chmod +x /usr/local/nagios/libexec/security_audit_completed.sh

The script above is passed one macro, the hostname (%host%). If you have worked with Nagios macros in the past, you will notice the format is different. A full list of the available macros in the Actions component format can be found in the documentation at the bottom of this post. Configure the action through the Actions component interface accessible on the “Manage Components” admin page in XI. We want this action to apply to every host, so we will use the regex: /.*/

We now need to configure the action:

Object Type: Host
Host: /.*/

Leave the other “Match Criteria” fields in the component blank for this example. Configure the “Action Type” and “Command Action” as follows:

Action Type: Command
Command: /usr/local/nagios/libexec/security_audit_completed.sh "%host%"
Action Text: Security Audit Successful!

Apply the settings and browse to any of your host’s details pages. Click the “Security Audit Successful” link and voila!, you should see a new comment after a moment or two declaring that the security audit was indeed successful.

All the portions of the component are explained in detail in the documentation. This example, among a few others can be found therein as well.
The one issue with this component was the lack of documentation, and with all of the potential uses and options, a small tutorial was necessary. The following document below walks though the basic options, explains the complex ones, and offers up a few use cases including adding comments from the link, writing to the command pipe and even emailing a ticketing system – all from hyperlinks on the details page of any Nagios object!
Actions Component Documentation

Managing Your Email Settings in Nagios XI

$
0
0

When monitoring your network environment, it is extremely important to receive email notifications properly.  The Manage Email Settings page was created to allow you to manage these settings and ensure that Users are properly notified by the XI server.

You can manage your Nagios XI server’s email settings through the Manage Email Settings page located in the Admin panel.  Your email settings can be configured either by Sendmail, or SMTP to transmit email Alerts and Notifications for potential infrastructure issues from Nagios XI to your Users or Contacts. The ability to use SMTP as opposed to Sendmail is particularly useful if you would like to add authentication via a SMTP relay to your outgoing Nagios XI mail.

The video tutorial below shows how email settings can be modified within Nagios XI.


Via YouTube

Monitoring a Nagios XI Server

$
0
0

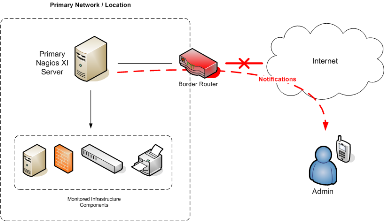
Many people rely on Nagios XI for their monitoring needs, but what happens if the primary XI monitoring server goes down, crashes, loses power, or gets disconnected from the network? For example, if your border router or internet connection goes down, Nagios XI will be unable to deliver email alerts to admins. See below:

Nagios XI - Monitoring a Nagios XI Server

The solution is to monitor the primary Nagios XI monitoring server from an offsite location to ensure it is both reachable and operating properly. You can accomplish this by simply running the Nagios XI Server Monitoring Wizard against your primary Nagios XI server. By default, the following checks are included: Ping, Nagios XI Web Interface, Monitoring Daemons, Monitoring Jobs, Load, and I/O Wait. In other words, the offsite Nagios XI instance is configured to only monitor the primary Nagios XI server. It is not configured to monitor all the individual infrastructure components that the primary server monitors. The design is quite simple – see the picture below:

Nagios XI - Monitoring a Nagios XI Server

Nagios XI is licensed for free usage if you monitor seven nodes or less, so in this instance you don’t need to purchase a separate license. This simple design allows you to minimize cost, while addressing potential problems with the primary Nagios XI server, and ensuring that monitoring contacts are notified in case of failures.

Watch the video below to see how easy it is to monitor your primary Nagios XI server:

More information can be found in the following document: Nagios XI – Monitoring a Nagios XI Server

Monitoring VMWare with Nagios XI

$
0
0

It is quite easy to monitor VMWare infrastructures in Nagios XI. All you need to do is run the VMWare monitoring wizard, provided you had previously installed the VMWare Perl Software Development Kit (SDK) on the Nagios XI server.

Note: To learn how to install SDK, please, refer to our “Nagios XI – Monitoring VMWare” document.

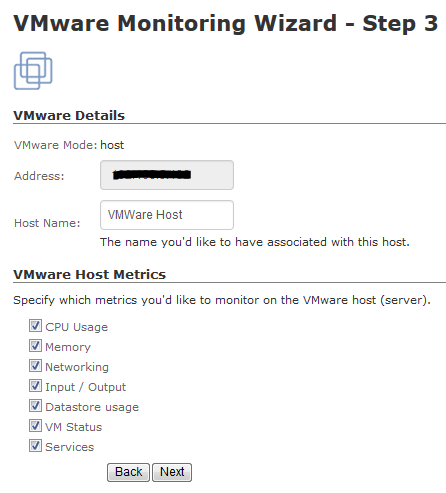
From the Nagios XI web interface, click on the “Configure” menu and select “Run the Monitoring Wizard”. Scroll down to select the VMWare monitoring wizard. Enter the IP address of the VMWare server, login credentials, select what you would like to monitor (VMWare host or a guest), and click “Next” to proceed. In Step 3 of the wizard, you will have to select the metrics that you would like to monitor such as CPU Usage, Memory, Services, etc.

VMWare Monitoring Wizard - Nagios XI

If you chose to monitor VMWare guests in Step 2, you will see an extra option in Step 3 – a Guest Selection tab.

VMWare Monitoring Wizard - Nagios XI

When you click on it, you will be able to select which guests you would like to monitor.

VMWare Monitoring Wizard - Nagios XI

Note: The VMs that are powered on will be automatically selected.

You can run through each of the remaining steps of the wizard or just click on the “Finish” button to accept the defaults.

Congratulations! You are now monitoring your VMWare infrastructure in Nagios XI.

VMWare Host - Service Status - Nagios XI

Watch our tutorial video on Monitoring VMWare infrastructure with Nagios XI below:

Watch this video on YouTube.

Monitoring Gas Prices Using Capacity Planning in Nagios XI

$
0
0

Nagios XI is the most powerful IT infrastructure monitoring solution on the market.  You can use it to monitor virtually anything.  Although Nagios XI is typically meant for more “serious” work, you can have some fun with it as well!  I guess I have been somewhat nostalgic lately…  Do you remember when a gallon of gas used to cost less than a dollar? :)

In this article I will show you how to install the check_gas_price.py plugin, set up a dummy host, and add multiple services to it.  This will allow you to check the gas prices in the USA.  Then you may use the Capacity Planning component in Nagios XI Enterprise Edition to view the trends of gas prices in the USA.

First, download the check_gas_price.py plugin from this URL:

http://assets.nagios.com/downloads/nagiosxi/scripts/check_gas_price.py

Next, install the plugin from the Nagios XI web interface by going to: Admin --> Manage Plugins --> Choose File, then select the check_gas_price.py file and click Upload Plugin.

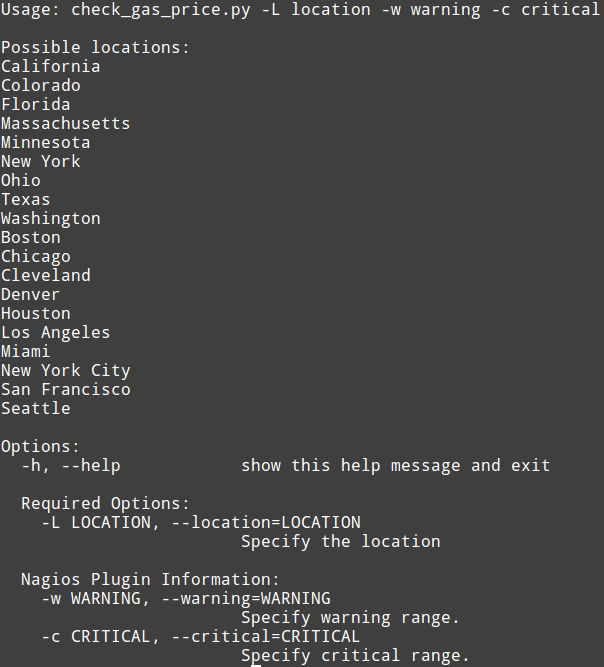
If you would like, you can view the plugins’ usage by typing in terminal:

/usr/local/nagios/libexec/check_gas_price.py -h

Your output should look like this:

Monitoring gas prices with Nagios XI - check_gas_price.py

 Create a new command by going to: Core Config Manager --> Commands –> Add New.  I named my command “check_gas_price” but you can use whatever name you like.

Add command name with Core Config Manager in Nagios XI

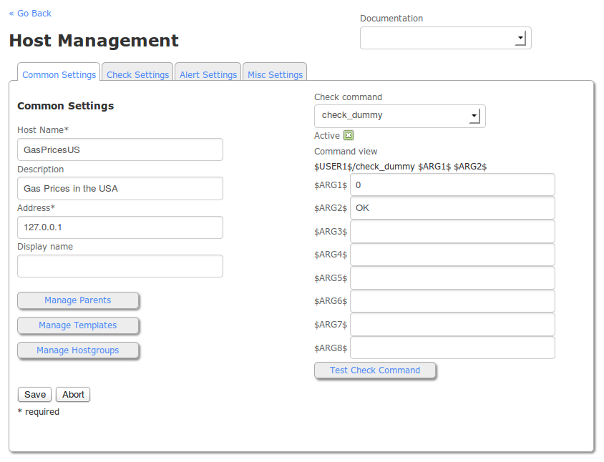
Next, create a dummy host and add some services to it for checking gas prices in the USA by selecting check_dummy from the Check Command dropdown.

Host Management in Nagios XI

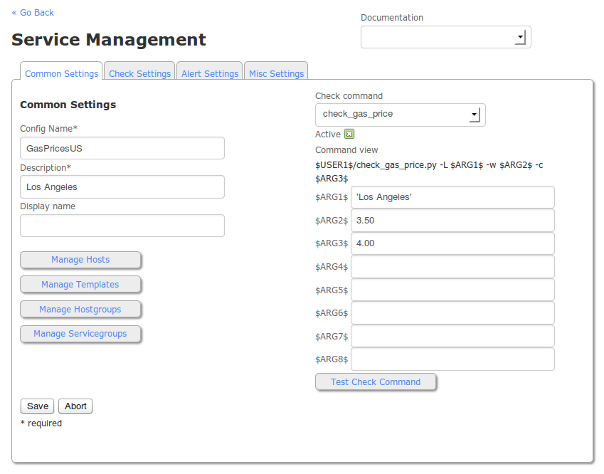
The values necessary to create a successful gas price monitor are as follows:

Config Name = The name of your “host”  (Note: in this case it is purely organizational, thus the name GasPricesUS)

Description = The name of the service as displayed by Nagios XI

$ARG1$ = Location (Note: This is limited to the list of cities and states found in the -h Help call for the plugin)

$ARG2$ = At what price would you like to receive a Warning notification?

$ARG3$ = At what price would you like to receive a Critical notification?

Service Management in Nagios XI

Note: Don’t forget to wrap the location in $ARG1$ in single quotes in case there is a space in the name.  If you don’t use single quotes, you will get syntax errors.

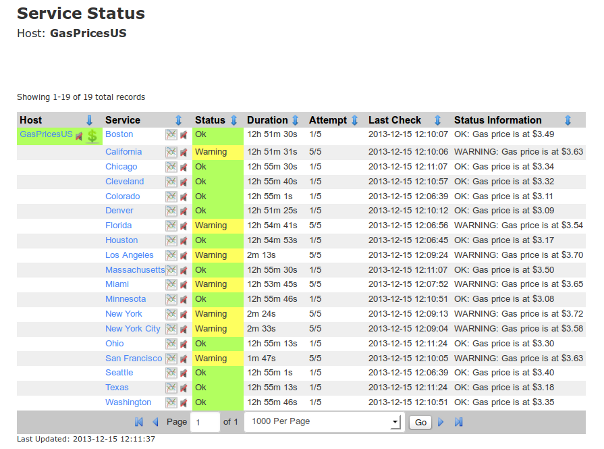
GasPricesUS Service Status in Nagios XI

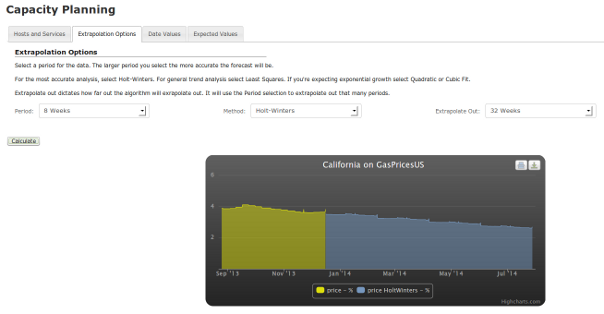
After monitoring gas prices for a good length of time, you can take the historical data that has gathered and use the Capacity Planning component to observe trends and forecast future gas prices.

Monitoring gas prices using Capacity Planning in Nagios XI

Here I used an 8 week period and extrapolated out 32 weeks.  I don’t believe the gas prices in California will ever reach $1/gallon (at least not any time soon), but I sure do like the trend that is shown on the graph. :)

If you want to learn more about the Capacity Planning component, view the documentation at the following link:

http://assets.nagios.com/downloads/nagiosxi/docs/How_To_Use_Capacity_Planning.pdf

If you want to see what other cool features are present in Nagios XI Enterprise Edition, please visit the URL below:

http://www.nagios.com/products/nagiosxi/whatsnew

Happy monitoring!

Using The Mass Acknowledge Component in Nagios XI

$
0
0

The Mass Acknowledge component in Nagios XI makes it very easy to mass acknowledge problems with hosts/services that are in non-OK state. The component allows you to suppress additional alerts to be sent out, while a team member works on resolving the issue(s). This component can also be used to schedule downtime for hosts/services, or schedule immediate checks in bulk.

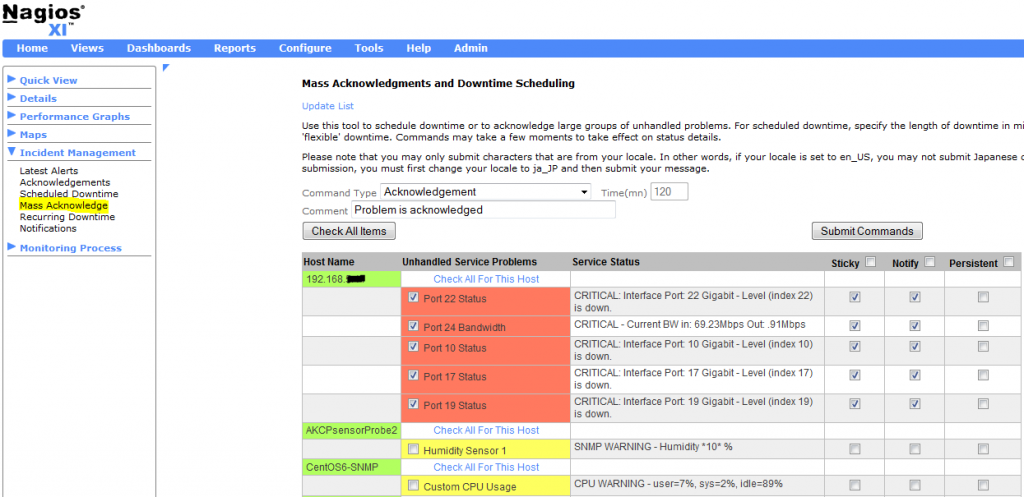
From the Nagios XI Home page, navigate to Incident Management –> Mass Acknowledge. Select the function you would like to use from the Command Type drop-down menu. Then, select the hosts/services you wish to target. You can select some of the hosts/services by clicking on each checkbox or you can select all of them at once, by clicking on the Check All Items button. If you suspect that there are more hosts/services in a non-OK state than those you see on the page, you can always click on the Update List button on the top to update the list.

Next, set the length of downtime in minutes, and enter a comment. You have an option to choose whether to send or not to send alerts. Simply select or deselect the appropriate Notify checkboxes. Also, you have an option to make some (or all) of your comments Sticky or Persistent.

Note: If you want acknowledgement to disable notifications until the host/service recovers, check the Sticky acknowledgement checkbox. On the other hand, if you would like the host/service comment to remain once the acknowledgement is removed, check the Persistent acknowledgement checkbox.

Finally, click on the Submit Commands button.

Mass Acknowledgements and Downtime Scheduling in Nagios XI

To verify that problems have been successfully acknowledged or downtime was scheduled, you can click on the Acknowledgements or Scheduled Downtime menus under the Incident Management section within the left hand menu.

Acknowledgements and Comments - Nagios XI

Below is a quick instructional video on how to use the component:

Watch this video on YouTube.

In fact, you can view the same video from within the Nagios XI web interface under the Mass Acknowledgments and Downtime Scheduling page, by clicking on the Help button in the upper-right corner (the orange icon with a question mark inside).

Viewing Help Videos in Nagios XI

Important: With the Mass Acknowledge Component, you can also remove scheduled downtimes in bulk.

This is something that you won’t find in the instructional video and not all of the Nagios XI users are aware of this functionality. If you scheduled downtime for many hosts/services (intentionally or by accident), you don’t have to remove them manually, one-by-one.

Simply navigate to Home –> Incident Management –> Mass Acknowledge, and scroll down to the Mass Remove Downtime section. Select the downtimes you wish to remove (you can also select all of them by clicking on the Check All button) and click on the Remove Downtimes button.

If you suspect that there are more hosts/services scheduled for downtime than those visible on the page, you can always click on the Update List button to refresh the list.

Mass Remove Scheduled Downtime - Nagios XI

Next, you can go back to Home  –> Incident Management –> Scheduled Downtime to verify that downtimes have been successfully removed.

Scheduled Downtime - Nagios XI

As you can see, it is very easy to mass acknowledge problems, and add/remove hosts/services for a scheduled downtime via the Mass Acknowledge Component in Nagios XI.

Happy monitoring!

Monitoring a Windows Machine with Nagios XI & NCPA

$
0
0

We have recently developed a cross-platform monitoring agent called NCPA that is designed to simplify the monitoring of devices with a wide variety of operating systems. NCPA can be used as a passive or active agent and monitors a multitude of different metrics right out of the box. In this article I will show you how easy it is to monitor a Windows machine with Nagios XI and NCPA. To do this, simply follow these 3 easy steps:

Step 1 – Installing and configuring NCPA on the remote box.

The NCPA installer can be downloaded here: NCPA’s Installer Direct Download. Instructions on installing NCPA can be found here: NCPA Installations Instructions. Download it on the Windows machine that you want to monitor and run the installer.

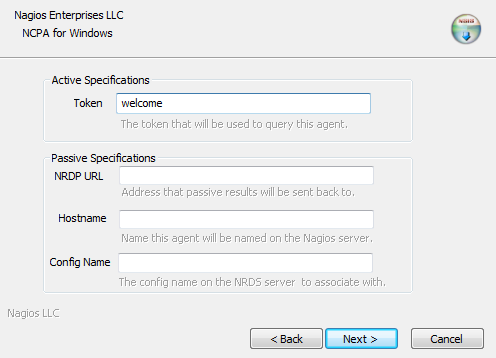
In this example, we will be using NCPA as an active agent.  This is the quickest and easiest way to begin monitoring with NCPA.  The image below is what the installation GUI looks like on the Windows device that you’re monitoring.  To use NCPA as an active agent, all you have to do is enter a token.  This token will be used to authenticate the connection between the Nagios XI server and the monitored device later in the article, so it’s important to choose a token you will remember. For this example, we entered “welcome“.  Click Next to finish the installation.

NCPA Installation Instructions

Step 2 - Testing your installation

Open a browser, type in the address bar:

https://<remote box ip address>:5693

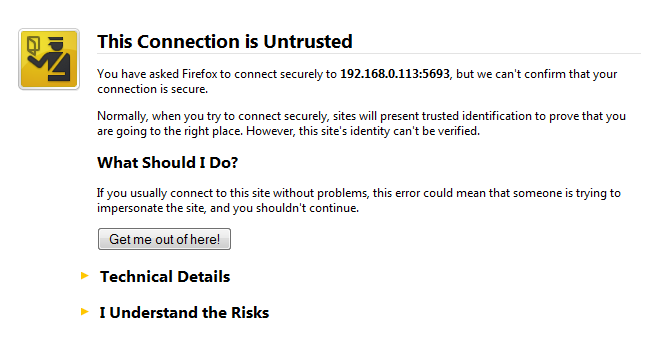
This is the address for the NCPA agent.  After attempting the connection you will get a “This Connection is Untrusted” message.

NCPA Untrusted Connection

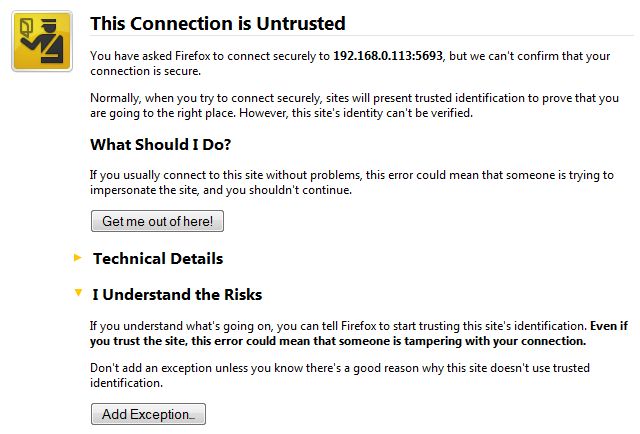
You will need to add a security exception in order to log in.

Security Exception

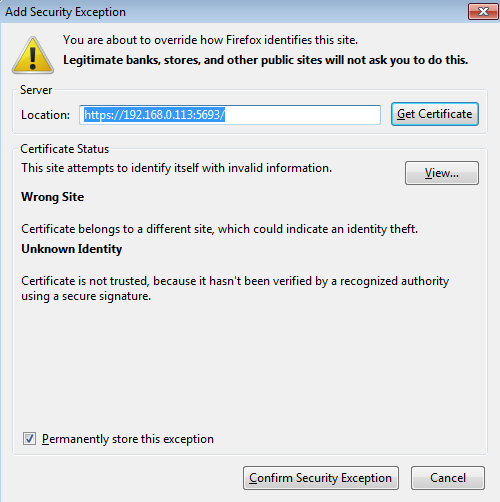
To add the the exception, click Add Exception… then enter the URL to the NCPA agent.

Add Security Exception

Once you’ve added the security exception, you should see the following login screen.  This is where you will need to enter the token for the remote machine.  In this example we used welcome“.

NCPA Login Screen

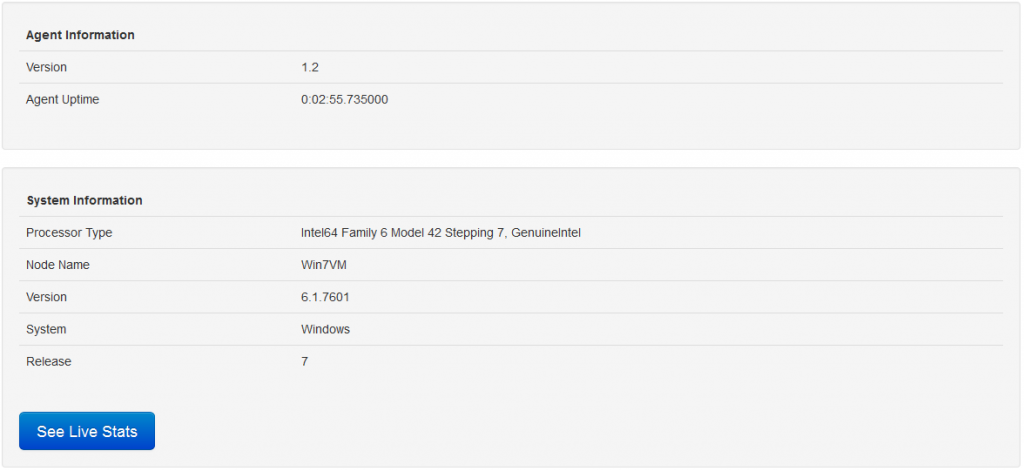
Once you log in, you will see a page similar to this one that shows the following agent information:

NCPA Agent Information

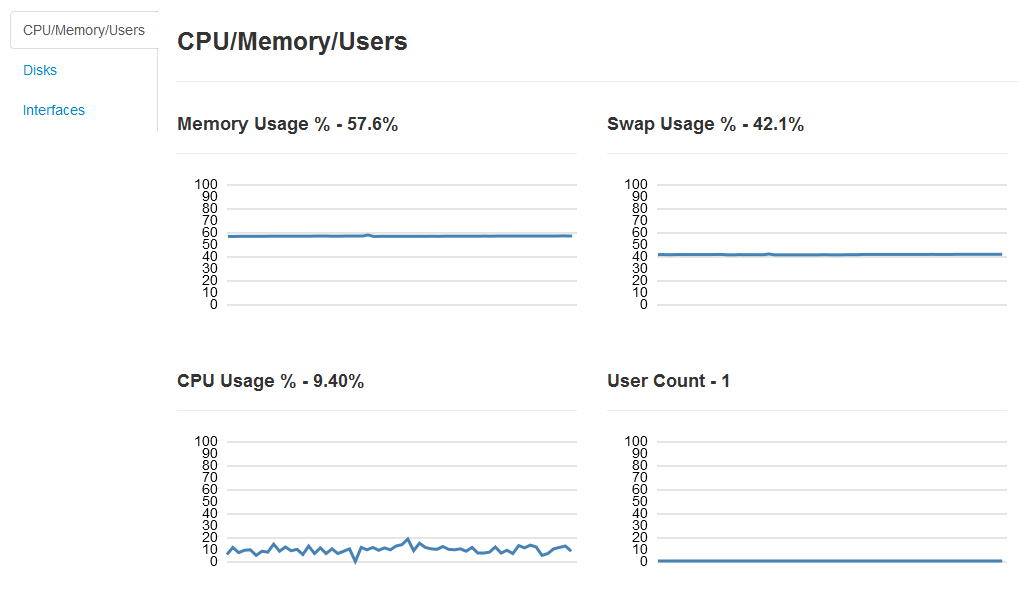
You can then click on See Live Stats to see the metrics on the Windows box. Each graph show in this view is a metric that can be monitored by Nagios XI.

NCPA Service Stats

Step 3 - Running the NCPA wizard on the Nagios XI box

From the Nagios XI web interface, go to:  Configure –> Run the Monitoring Wizard --> NCPA Agent.

NCPA Monitoring Wizard Icon

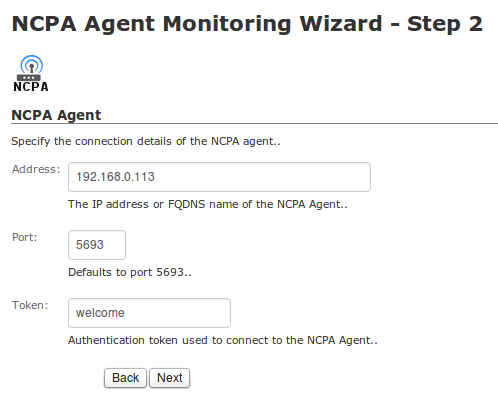
We’re using NCPA as an active agent, so all we have to enter in step 2 of the Wizard is the IP address of the remote Windows machine and the token we entered.

The last step of the wizard asks you which services you wish to monitor.  Click Apply and wait for Nagios XI to schedule the checks.  Once the checks are received, you’ll be able to view them in the Service Status dashboard.  The screenshot below shows successful checks from NCPA.


Successful NCPA Checks

NCPA is a powerhouse agent and has many other use case scenarios.  Now you have the knowledge to monitor your Windows machines with this flexible agent and Nagios XI.

Happy Monitoring!


Monitoring A Linux Machine With Nagios XI & NCPA

$
0
0

Last week we discussed monitoring a Windows machine with NCPA and Nagios XI to make sure that the server was functioning properly.  In order to showcase the cross-platform capabilities of NCPA (Nagios Cross-Platform Agent) we decided it would be a good idea to show how to monitor a Linux machine as well.  In this article I will show you how easy it is to monitor a Linux box using the same exact agent that we used to monitor the Windows box last week.  Here’s how you do it.

1. Installing and configuring NCPA on the remote box

Instructions on installing NCPA can be found here: NCPA Installations Instructions. For more info on acquiring the correct RPM packages for your Linux distro, please check our documentation here: Finding the Right RPM

Run the following commands from the command line as root:

cd /tmp
wget http://assets.nagios.com/downloads/<your rpm package>.rpm
rpm -ivh --nomd5 <your rpm package>.rpm

Note: For my example, I used CentOS 6.5, 64-bit, so I ran:

cd /tmp
wget http://assets.nagios.com/downloads/ncpa/ncpa-head.el6.x86_64.rpm
rpm -ivh --nomd5 ncpa-head.el6.x86_64.rpm

Next, you will have to edit the “community_string” in the NCPA config file. The “community_string” is the token that you will use to log into the agent and also allows the Nagios XI server to communicate with the NCPA agent. This process is comparable to entering a token in the GUI installer when monitoring a Windows machine.

To change the default value of the “community_string”, edit the ncpa.cfg file located in the /usr/local/ncpa/etc/ncpa.cfg directory. We suggest choosing something secure. Then, restart the “ncpa_listener” by running the following commands so that the changes can take effect:

/etc/init.d/ncpa_listener restart

Check if the ncpa_listener is indeed running:

ps -ef | grep ncpa

If the ncpa_listener is running, you shouled see something like this:

root 11465 1 0 14:31 ? 00:00:12 ./ncpa_posix_listener --start

Step 2 – Testing your installation

Open a browser, and go to the NCPA agent site to confirm it’s running:

https://<remote box ip address>:5693/api

You should see the login screen that looks something like this:

NCPA Login Screen

This is where you will need to enter the community_string (token) that we edited in the previous step.  Once you log in, you will see a page similar to this one that shows the following agent information:

NCPA Agent Information
You can then click on See Live Stats to see the metrics on the Windows box. Each graph show in this view is a metric that can be monitored by Nagios XI.

NCPA Service Stats

Step 3 – Running the NCPA wizard on the Nagios XI box

From the Nagios XI web interface, go to:  Configure –> Run the Monitoring Wizard –> NCPA Agent.

NCPA Monitoring Wizard Icon

We’re using NCPA as an active agent, so all we have to enter in step 2 of the Wizard is the IP address of the remote Linux machine and the community_string (token) we edited in step 1 of the configuration. This will allow Nagios XI to communicate with the NCPA agent on the Linux machine.

NCPA Monitoring Wizard

The last step of the wizard asks you which services you wish to monitor.  Click Apply and wait for Nagios XI to schedule the checks.  Once the checks are received, you’ll be able to view them in the Service Status dashboard.  The screenshot below shows successful checks from NCPA.

NCPA Service Status Dashboard

NCPA is a powerhouse agent and has many other use case scenarios. For more information on ways to use NCPA, view the NCPA Documentation or visit our support forums.


Happy Monitoring!

Meet Our Team: Nick Scott – Developer

How to Passively Monitor Linux Machines with NRDS & Nagios XI

$
0
0

When active agent-based monitoring is not an option (because of a firewall, or security restriction), passive monitoring can provide the solution necessary to maintain network security and health. Today we will be discussing Nagios Remote Data Sender (NRDS) and how it can monitor Linux machines using passive check results. Passive results are sent to the Nagios Remote Data Processor (NRDP) server and processed in Nagios XI.

The NRDS client configuration can be managed centrally via the NRDS Config Manager Component in Nagios XI. Updated configuration files on the NRDS server are automatically picked up by all clients. The NRDS client runs on a cron job at a specified interval. Each time it runs, it will do the following:

  • Run all of the commands, specified in the config file
  • Send the results back to the Nagios XI server
  • Check if there is a new version of the configuration file on the Nagios XI server, and if there is one, it will download it
  • Download all of the plugins it needs from the server and install them on the client

In this article, I will show you how you can start monitoring a Linux host passively in three easy steps.

Step 1  - Adding Configuration

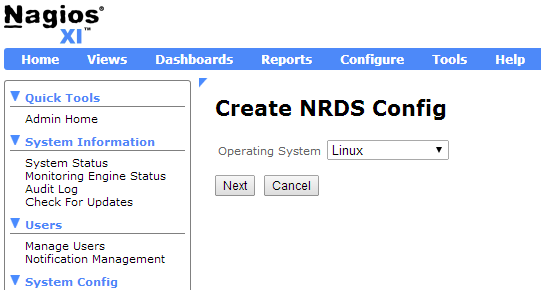
Go to Admin -> Monitoring Config -> NRDS Config Manager, click on Create Config, and select Linux from the Operating System drop-down menu.

Create NRDS Config

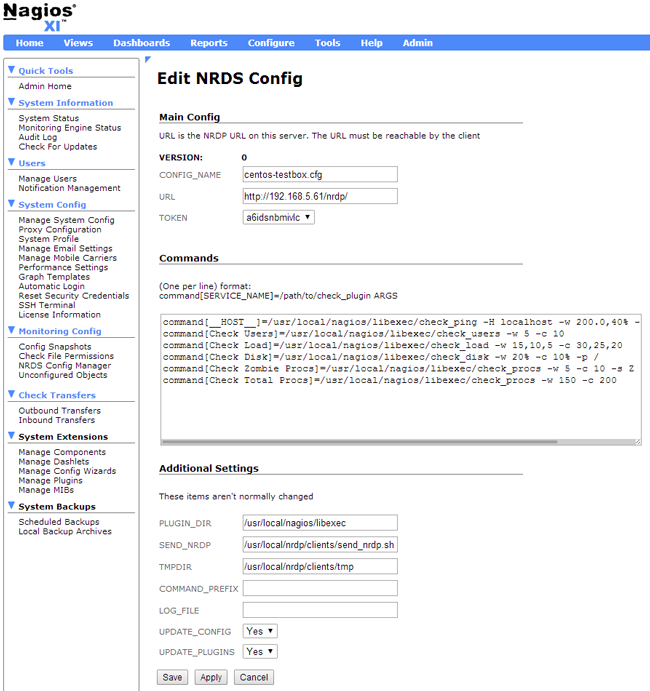
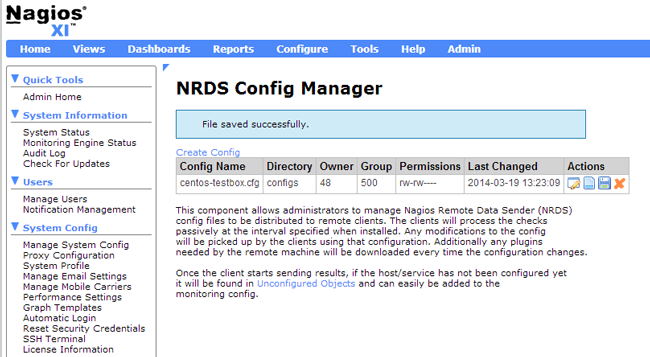
Most of the config options will already be populated for you with the default options. All you will need to do is type a config name, select a token from the drop-down menu, and click on the Apply button. For this example, we will be creating a config called “centos-testbox.cfg.”

Edit NRDS Config Nagios XI

For more information on editing configuration files in NRDS, please, watch the video below:

Watch this video on YouTube.

Step 2 – Client Installation

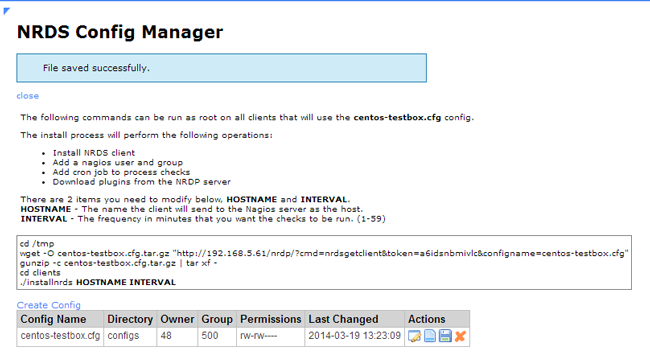
Now we must install the client. Go back to the NRDS Config Manager (Admin -> Monitoring Config -> NRDS Config Manager). You will see the new configuration file, that you just created (in this case it is called centos-testbox.cfg).

NRDS Config Manager

Click on the “Client Install Instructions” button (the “Notepad” icon) to view the commands that you need to run on the client.

Client Installation Instructions NRDS

Run the following Client Install Instruction commands from the terminal on the client machine. In the last command you will need to enter the hostname and the time interval you would like to use.

cd /tmp
wget -O centos-testbox.cfg.tar.gz "http://192.168.0.100/nrdp/?cmd=nrdsgetclient&amp;token=nagios&amp;configname=centos-testbox.cfg"
gunzip -c centos-testbox.cfg.tar.gz | tar xf -
cd clients
./installnrds CentOSVMx64 5

In the output you should see a confirmation that the client was installed.

Group nagios does not exist. Creating...
User nagios does not exist. Creating...
Installing NRDS Client
Adding cron jobs for CentOSVMx64 at a 5 minute interval
no crontab for nagios
Crontabs installed OK
Updating config and plugins
Updated config to version 0.1 Updated 7 plugins
Installation complete

You can view the crontab entry by running the following command:

crontab -u nagios -l

Step 3 – Configure The Host And Its Services

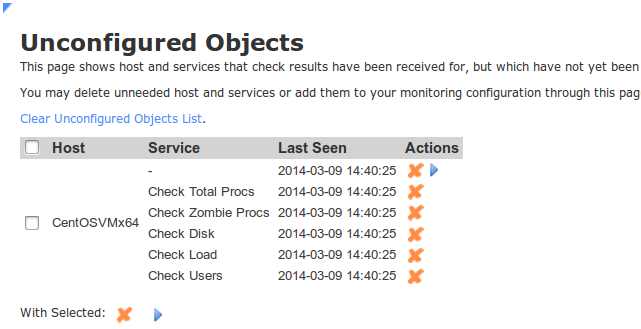
The last step is to configure the host and its services. From the Nagios XI web interface, click on Admin -> Monitoring Config -> Unconfigured Objects.

Select the checkbox next to the host, and click on the Configure button (the blue triangle).

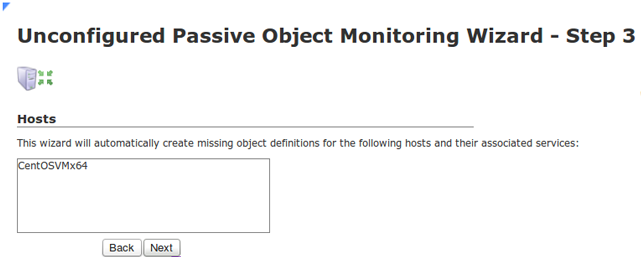
Click on the Next button to proceed and complete the Unconfigured Passive Object Monitoring Wizard.

Unconfigured Objects Monitoring Wizard NRDS

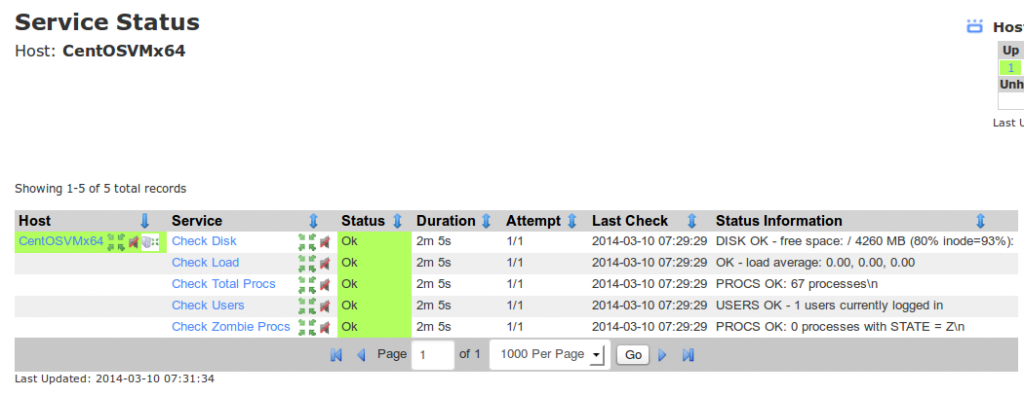
 You have now successfully configured a Linux host for passive monitoring with NRDS in Nagios XI.  The checks can be viewed in the Service Status Dashboard.

Service Status Dashboard Passive Check Nagios XI

For more information about passive monitoring with Nagios XI and NRDS here:

Passive Monitoring with NRDS and Nagios XI

Watch the the NRDS video tutorial here:

Nagios Remote Data Sender Tutorial

Happy Monitoring!

Meet Our Team: Jake Omann – Developer

$
0
0

Meet Jake Omann – one of our top notch developers here at Nagios Enterprises.  Jake is a key developer of many of our commercial-grade Nagios solutions, including Nagios XI, Nagios Network Analyzer, and Nagios Fusion.  His ability to patch bugs and crank out new cool features is nearly unrivaled!  Learn more about Jake, his role at Nagios, and plans for future projects in this week’s “Meet Our Team Interview.”

Watch this video on YouTube.

Monitoring AKCP sensorProbe2 with Nagios XI Using SNMP

$
0
0

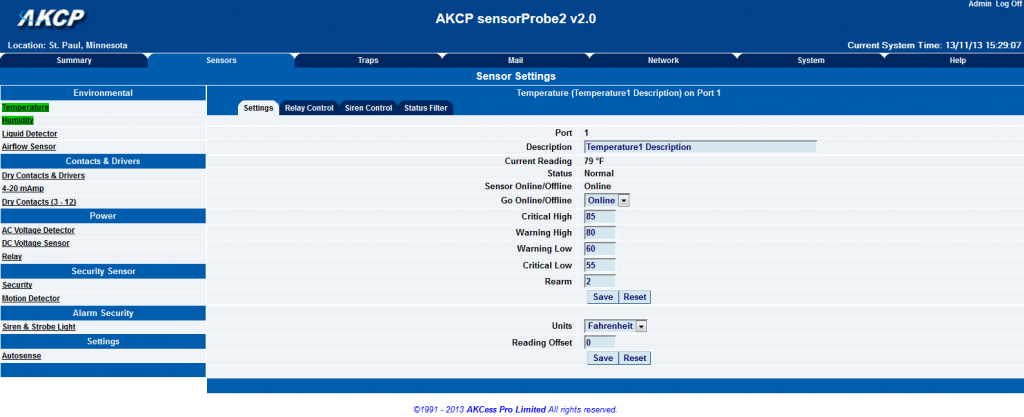
The sensorProbe2, sensorProbe4, sensorProbe8 and Probe8-X20 are intelligent devices for monitoring environmental variables, power, physical threads and security. Various AKCP intelligent sensors can be connected via the RJ45 connectors to the sensorProbe devices.

AKCP sensorProbe2 Web Interface

I would like to show you how easy it is to monitor a Dual Temperature/Humidity AKCP Sensor in Nagios XI via SNMP active checks and SNMP traps.

Not everyone realizes how important a proper temperature control is. If there is an air conditioning malfunction or abnormal weather conditions, damage to information, delicate electronic equipment or warehouse stock may occur.

With Nagios XI, you can easily monitor a Dual Temperature/Humidity AKCP sensor via SNMP and SNMP Traps. All you need to do is to run the SNMP and the SNMP Trap Monitoring Wizards! It takes less than 15 minutes to get your host set up and running.

Nagios XI Service Status - AKCP sensorProbe2

To learn how you do this, please, review our ”How to Monitor an AKCP sensorProbe2 using SNMP” document.

Heartbleed: One Bug to Rule Them All

$
0
0

If you’ve missed the news in the last few days, OpenSSL has been found to contain a rather large issue it’s implementation of TLSv1.1 and TLS1.2 for versions 1.0.1 through 1.0.1f and 1.0.2-beta. Thankfully, no other versions contain this issue and due to responsible disclosure, a patch is already available in the form of OpenSSL 1.0.1g, which many distributions are already making available via standard package management, such as yum and apt.

As for the juicy details… Heartbleed is a vulnerability caused by a missing bounds check and lack of validation, with the TLS heartbeat extension, that allows for up to 64k of memory to be leaked to an attacker. This is done via initializing a TLS connection over TCP or UDP. When this connection is begun, a heartbeat is shared between the client and server to validate that they are both in good working order. If a malformed, specifically empty, heartbeat is sent, the responding client or server will attempt to copy memory from a packet that is not available and instead respond with data that was previously at the same location that the packet should have been located in memory on the victim’s system. The process is not limited to a newly initialized connection and may be repeated at any point in time with existing connections as well. This could result in leaked memory containing rather benign and large chunks of empty memory or severe issues such as private encryption keys, session id’s, passwords, and anything else that might be in the server’s memory.

Just to clarify, this can affect both clients and servers. Yes, your Android phone’s web browser is just as affected as your Apache web server or OpenLDAP server. So, while updating your OpenSSL version, firmware and operating system are extremely important, one must also consider applications and services that ship with internal versions of OpenSSL or include libraries with compilation that standard updates may not correct.

Resolving this on most systems including current CentOS, RHEL, and Debian based distributions can already be found via standard updates with the included package managers. Systems that do not currently provide updated versions of OpenSSL can be manually updated by building version 1.0.1g from source or building previous versions with the -DOPENSSL_NO_HEARTBEATS flag. In the case of embedded systems such as switches, routers and phones, a firmware update request may have to be made to the vendor directly.

After seeing the large effect this particular bug is having worldwide, we decided to modify existing proof of concept code and provide Nagios users with an automated way to check your systems. Through a Nagios plugin, you can now validate whether your TCP services are vulnerable to the bug with both TLSv1.1 and TLSv1.2. Soon to be implemented updates will include checking of STARTTLS vulnerabilities and UDP connections.

Without further ado, we present the check_heartbleed plugin and heartbleed testing page.

Nagios Exchange: check_heartbleed.py
Nagios.com/heartbleed-tester

Nagios Network Analyzer Available in Amazon EC2 Cloud

$
0
0

Amazon Web Services (AWS)We are pleased to announce that you can now easily launch your Nagios Network Analyzer monitoring server in the Amazon Elastic Compute Cloud (EC2). We have clean CentOS 6 images with Nagios Network Analyzer pre-installed available for public and customer use. This makes it extremely easy for Nagios Network Analyzer administrators to start additional servers without the need to procure or invest in hardware. Additionally, those wishing to demo Nagios Network Analyzer can easily do so using the cloud.

Nagios Network Analyzer is a commercial-grade network flow data analysis solution that provides organizations with extended insight into their IT infrastructure and network traffic. Network Analyzer allows you to be proactive in resolving outages, abnormal behavior, and security threats before they affect critical business processes.

Watch this video on YouTube.

View a full how-to document on launching a new pre-installed Nagios Network Analyzer server in the Amazon EC2 cloud: Using Nagios Network Analyzer In Amazon EC2 Cloud

If you are new to Nagios Network Analyzer and would like to see it in action, this would be a fast and efficient way to give it a test run. The pre-configured image comes with a fully functional 60 day free trial.

Remember, Nagios World Conference 2014 is coming up in October. Register here for 10% off your conference pass. Act now, because this offer won’t last long!


Monitoring Your MongoDB Database and Server with the New Wizards in Nagios XI 2014

$
0
0

Every once in a while, a new database pushes to the front of the news. These databases generally bring a renewed schema and some neat tricks and features others may not offer. Due to the increasing popularity of MongoDB NoSQL databases, we have designed two new wizards for use with Nagios XI 2014: the MongoDB Database Wizard, and MongoDB Server Wizard.

MongoDB Database Wizard - Nagios XI 2014

 MongoDB Database Wizard will allow you to monitor key metrics such as:

  • Number of Collections in the database
  • Number of Objects in the database
  • The size of the MongoDB Database

Below is an example of the MongoDB Database service checks in action:

MongoDB Database Service Check Results in Nagios XI 2014

MongoDB Server Wizard - Nagios XI 2014  MongoDB Server Wizard will allow you to monitor key metrics such as:

  • Time to connect to and authenticate with the Database server
  • Percent of Free Connections
  • Server Memory Usage
  • Percentage of time the MongoDB server is locked
  • Average time it takes to preform a flush
  • Time since the last flush
  • Ratio of index hits to misses
  • Number of Databases
  • Number of Collections
  • Queries per second

MongoDB Wizard Metrics in Nagios XI 2014

Below is an example of the MongoDB Server service checks in action:

MongoDB Server Service Check Results in Nagios XI 2014

As you can see, there are quite a handful of useful metrics to monitor, which will help keep you – and your admins – both assured of the MongoDB Database’s health and usage, as well as notified of key issues that may arise. View a full how-to document on using the MongoDB Database Wizard at Monitoring MongoDB Database With Nagios XI and the MongoDB Server Wizard at Monitoring MongoDB Server With Nagios XI.

These two wizards come prepackaged with Nagios XI 2014. If you would like to try out either of the MongoDB wizards and see the latest version of Nagios XI 2014  in action, you can give it a test run by downloading Nagios XI 2014 here with a fully functional 60 day free trial.

Remember, Nagios World Conference 2014 is coming up in October. Register here for 10% off your conference pass. Act now, because this offer won’t last long!

Come see Sam Lansing present at Nagios World Conference 2014

Check Out the New Scheduled Backups Component in Nagios XI 2014

$
0
0

One of the coolest new features in Nagios XI 2014, is the Scheduled Backups Component. Backups may not sound cool and exciting, but in the event that your Nagios system has a major issue, or you want to restore on a fresh system, having off-disk backups can be a lifesaver. The Scheduled Backups Component also makes backups extremely easy and straight forward! Are you excited yet? If not, you’ll get there once we are done going through the many available options.

To get started head over to your local Nagios XI machine, and log into the web interface. Once you’re in, open up the Admin page and select Scheduled Backups, down on the bottom left area of your interface. You should see all three backup options are initially disabled, and there is currently no last backup size, as none have been run.

Nagios XI 2014 Scheduled Backup Component

Looking a little lower, notice the three tabs for each backup option. The three main options for backups are FTP, SSH\SCP, and local backup. While each has it’s own settings pertaining to specifics of that protocol, some settings are the same between them. Some similar settings would be; enabling backup type, scheduled backup time, storage directory, and backup limit. The FTP and SSH\SCP tabs have similar but unique settings as well, such as server, port, username, and password. Once these details are filled in, you can test the connection and upload ability on remote systems, and folder permissions on local paths.

FTP Settings For Scheduled Backups Within Nagios XI 2014

Once your settings are tested and correct, press the Update Settings button to save the changes to any and all backup types. The next time you are here, these same setting will populate back in and you should see one or more green checked circles displaying which are enabled.

Nagios XI 2014 Scheduled Backup Component

Should you need to restore one of you backups, simply follow the Restoring From A Backup section on pg.2 of the Backing Up And Restoring Your Nagios XI System document.

If you would like to try out the new Scheduled Backups Component and see the latest version of Nagios XI 2014  in action, you can give it a test run by downloading Nagios XI 2014 here with a fully functional 60 day free trial.

Remember, Nagios World Conference 2014 is coming up in October. Register here for 10% off your conference pass. Act now, because this offer won’t last long!

Come see Spenser Reinhardt present at Nagios World Conference 2014

Using the New SLA Report within Nagios XI 2014

$
0
0

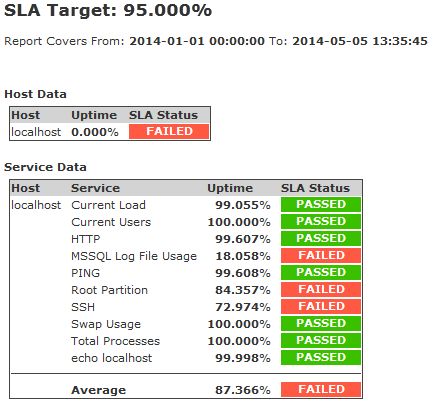
New to Nagios XI 2014, is the ability to generate reports based on service level agreement (SLA) statistics. In addition to the already included Availability Report, the SLA Report gives you the ability to prove, via already monitored hosts and services within your Nagios system, that you are meeting or exceeding those pesky up-time agreements.

Options for SLA Reporting in Nagios 2014

As per traditional Nagios XI reporting capabilities, there are a wide variety of included time periods that will fit most use cases, as well as the ability to generate reports based on custom time periods. Reports can also be filtered by Host, Hostgroup, and Servicegroup for maximum flexibility when only specific hosts and services need to have reports generated. The final important aspect when generating a report is the modifiable SLA Target value. This allows you up to 5 points of precision when generating reports and can fully calculate the five 9s(99.999%) used in so many cases.

Once a report is generated, you are presented with the overall SLA percentile reached for both hosts and services included within your parameters. Initially, the report may look sparse, however selecting the Show Details link for either hosts or services, will greatly expand the page and show metrics for each group.

Expanded SLA Report within Nagios 2014

You can find more details on the new SLA Report’s functionality at Generating SLA Reports With Nagios XI

If you would like to try out the new SLA Report and see the latest version of Nagios XI 2014  in action, you can give it a test run by downloading Nagios XI 2014 here with a fully functional 60 day free trial.

Remember, Nagios World Conference 2014 is coming up in October. Register here for 10% off your conference pass. Act now, because this offer won’t last long!

Come see Spenser Reinhardt present at Nagios World Conference 2014


Exploring the New JSON CGIs in Nagios Core 4.0.7! (Part 1)

$
0
0

The JSON CGIs, from the JSON branch of core, have been officially released with Nagios Core 4.0.7!

The original design goals were:

  1. To provide all information available in current CGIs in JSON format.
  2. Place the presentation responsibility on the client to minimize network traffic and server load.
  3. Perform operations on the server side that are significantly more easily done there.
  4. Spark community developers to create new Nagios Core UI’s from the easy to work with JSON from the CGIs.

The CGIs provide an API to query object, status, and historical information through GET requests.  They use the same authentication as other CGIs.  Once queried, they return valid JSON that can be parsed into JavaScript objects for client side models and processing.  The API is very robust, providing multiple ways to limit queries – name/descriptions, host/service groups,  update/changes times, among many others.

The three new CGIs are:

  1. objectjson.cgi  (object configuration)
  2. statusjson.cgi  (status information)
  3. archivejson.cgi  (historical logs)

Additionally, a new web app is included – jsonquery.html & jsonquery.js.  This is a small UI for crafting GET requests, it can be used to trial specific parameters for GET requests, or to just explore the api.  It is also the easiest way to get acquainted with the new CGIs.

Installing the JSON CGIs:

cd /tmp
wget http://prdownloads.sourceforge.net/sourceforge/nagios/nagios-4.0.7.tar.gz
tar vfxz nagios-4.0.7.tar.gz
cd nagios-4.0.7
./configure   (specify extra configure options as needed)
make all
make install

You can run the "./configure" command with extra configuration options  as needed.

Post install, you should find the 3 new CGIs in /usr/local/nagios/sbin, and the jsonquery html and js files in /usr/local/nagios/share.

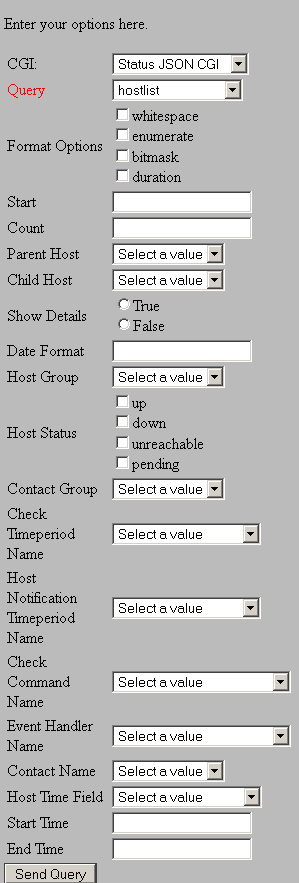
To get started using the CGIs: Browse to the jsonquery.html url in your web browser:

http://<nagios server>/nagios/jsonquery.html

You should see a small UI just waiting to be explored:

json-query-generator

  1. Choose Status JSON CGI from the CGI dropdown
  2. Select hostlist for the query dropdown
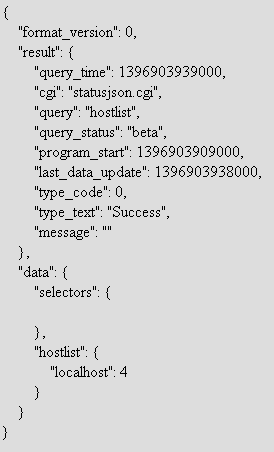
  3. Click the Send Query button
  4. The right hand pane should now display a prettified JavaScript object
  5. You can then save the url, parametrize it, etc for use in ajax calls and/or integration into custom front-ends.


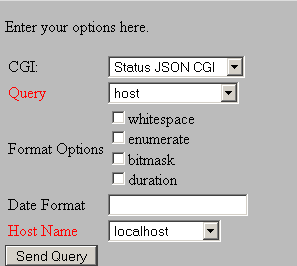
The query above was fairly basic.  Let’s query some more specific information:

  1. Choose Status JSON CGI from the CGI dropdown
  2. Select host for the query dropdown
  3. Select a hostname from the Host Name dropdown
  4. Click the Send Query button
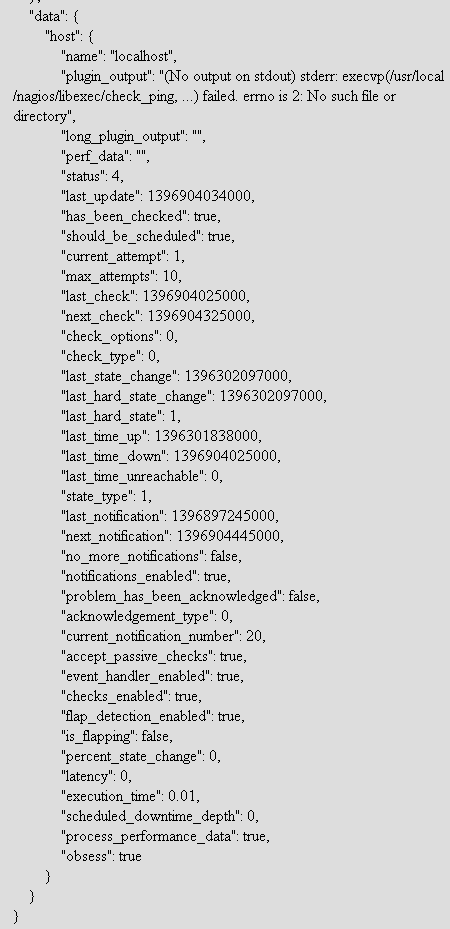
  5. You should now see detailed information for the specific host returned in the JSON

Feel free to play around with the numerous options.  The CGIs are highly versatile and work well with ajax loops for custom front-ends and client-side models.  This is version 1 of the CGIs, so if you find any bugs, please report them to http://tracker.nagios.org.  More features are planned, so stay tuned!

If you utilize the new feature to create a new addon for Nagios, please share it back with the community by posting it on the Nagios Exchange.

In part 2 (coming soon) I will cover some use cases for the new CGIs and provide a short walk-through covering the creation of a (small) custom front-end.

Remember, Nagios World Conference 2014 is coming up in October. Register here for 10% off your conference pass. Act now, because this offer won’t last long!

Come see Andy Brist present at Nagios World Conference 2014


Monitoring Website Defacement with Nagios XI 2014

$
0
0

There’s a new wizard in town and I don’t mean Gandalf the White!  The Website Defacement Wizard is a new wizard available in the latest release of Nagios XI 2014.

One of the worst things a company can suffer PR-wise is website defacement. At best, it will require restoring the page, and at worst it can be a nightmare of log review, security patches, and damage control. Time is of the essence in such a situation, so being alerted as soon as possible is of utmost importance. That’s where the Website Defacement Wizard comes in handy.

The Website Defacement Wizard allows you to monitor a web page for certain keywords, either alerting if they are present in the case of offensive or spam-related words, or alerting if they are missing, which may indicate a whole-page defacement. We provide a few pre-defined lists of words you may wish to look for, sorted into categories such as Profanity and Gambling. You can also add your own words or phrases, or remove certain words if they might be expected on the page (such as “unisex” on a page discussing clothing). If you would rather check to ensure the existence of a word or phrase, the process is similar and will be described in this article.

So without further delay, let’s walk through setting up a check:

In the Nagios XI interface, go to the Configure tab and click Run the Monitoring Wizard. Scroll all the way down the page and click Website Defacement.

Website Defacement Wizard - Nagios XI

On this first page, you will enter the URL you would like to monitor. Be sure to specify the exact web page otherwise the default page will be used. Click Next.

The first few options on this page can probably be left as-is. The hostname can be configured as with most other wizards, and the Service Name Prefix will be prepended to all services created by the wizard as a means of identification. You can configure whether or not to use SSL and what port to use, as well as credentials if they are required.

The real meat of this page is the Defacement Monitoring Services section. There are two primary methods, and I will go over each in turn.

The first is the Defacement Content Locator and is useful for keeping an eye on pages with user-submitted content such as forums, guestbooks, and comment sections. You have three options here:

  1. Manually enter in your own list of words/phrases, one on each line
  2. Upload a text file containing a list of words/phrases, also one on each line
  3. Check the appropriate boxes for our pre-defined lists

Editing the keywords in the Nagios XI Website Defacement Wizard

You can mix and match each of the options, however in our example we simply used the Marketing wordlist.

The second is the Web Page Regular Expression Match. You might use this to detect a traditional defacement by watching a page to ensure that a word is found. In our example, we are simply looking for the word Nagios, since it should definitely appear on the page if it has not been defaced. You can also use regular expressions to specify a pattern to look for, and you can enter multiple search terms by separating them with the pipe character “|”.

Regular Expression Match in the Nagios XI Website Defacement Wizard

Once you have finished configuring the check, go ahead and click Next. From here you can customize the check settings like any other wizard, otherwise you can click Finish to apply the configuration. After the Apply Config has completed, we need to make one change to the services. Some sites will issue a HTTP 301 code which is just a simple redirect and can cause some issues with check_http-based checks. For this example we will need to add the “-f follow” switch to our two checks like so:

List of Defacement Services in the Nagios XI Website Defacement Wizard

Wordlist Match Check: Wordlist Match Service Detail - Website Defacement Monitoring in Nagios XI

Regular Expression Match Check:

Regular Expression Match Service Detail - Website Defacement Monitoring in Nagios XI

Then we will click Apply Configuration again.

Back on the Home page, we can look to the Service Detail sub-page for the new services and see the check results:

Check Results - Website Defacement Monitoring in Nagios XI

There you have it! Thankfully, it looks like our Nagios webpage has not been defaced.  As always, if you need any assistance setting up this or any other checks, please do not hesitate to visit us on the Nagios Support Forums.  View a full how-to document on using the Website Defacement Wizard at Monitoring Website Defacement With Nagios XI

This wizard come prepackaged with Nagios XI 2014. If you would like to try out the Website Defacement Wizard and see the latest version of Nagios XI 2014  in action, you can give it a test run by downloading Nagios XI 2014 here with a fully functional 60 day free trial.

Remember, Nagios World Conference 2014 is coming up in October. Register here for 10% off your conference pass. Act now, because this offer won’t last long!

Come see Trevor McDonald present at Nagios World Conference 2014

Viewing all 65 articles
Browse latest View live